The results of our 2015 Policy Practices Survey are in, and reveal that 94.5% of participants have formalized policies (up from 89.8% in 2014).
Here are a few more highlights of the survey:
- At-will employment policies are in place for 81.4% of respondents (77.5% last year).
- 34.6% of our participants’ at-will policies include a “no contract” disclaimer (32.4% last year).
- 53.5% use information from commercial vendors to develop policies.
- Employee leave is identified as problematic for 17.4% of respondents.
- Nearly 75% of background checks are done by outside vendors.
- 63% of respondents provide employees with a complete set of policies.
Thanks to all 1,414 individuals who participated! Here are the detailed results.
Who Participated?

The survey was conducted in July 2015. Of those who identified themselves, 56.9% are privately owned for-profit organizations, 21.1% are not-for-profit organizations, 10.8% are public corporations, and 11.2% are government entities.
Companies with 1–250 employees account for 60.5% of survey participants. Companies with 251–500 employees make up 11.4% and organizations with 501–1,000 comprise 8.4%. Rounding out the group, companies with 1,001–5,000 account for 12.9% and organizations with more than 5,000 employees account for 6.7% of survey participants.
A little over half (61%) of the participants are in service industries; 21.6% are in agriculture, forestry, construction, manufacturing, or mining; 9.3% are in wholesale, retail, transportation, or warehousing; and 8.3% are in public administration, real estate, or utilities.
Staff level employees account for 12.5% of the survey participants who self-identified. Supervisors represent 4.5% and manager level survey participants account for 39.5%. Director level accounts for 26.8% and 16.4% are VP or higher.
Do you know what the future of your HR operations looks like? Join us on Wednesday, September 30, 2015, for a new interactive webinar—Strategic Planning for HR: A Blueprint for Creating Aligned and Adaptable Plans. Learn More
Policy Development

Of the survey participants that answered, policy development falls in the lap of HR management for 74.9%, down slightly from 76.1% in 2014. Senior management involvement inches up, however, with 79.9% participating in 2015 versus 78.5% in 2014. Outside legal counsel continues to bounce up and down with 42.7% having a hand in policy development in 2015, compared to 56.2% in 2014 and 24.6% in 2013. Rounding out the group are supervisors/managers for 31.7% (33.1% in 2014 and 9.4% in 2013) along with employees at 8.2%. Consultants are involved in policy development for 10.5% of participants (9.4% in 2014 and 5.9% in 2013) and 6.1% indicated “other”, which includes policy committees and union contracts, as well as boards of directors.
For organizations that use outside resources other than legal counsel, 59.8% (54% in 2014 and 60.9% in 2013) use information from trade associations to develop their policies. Also, 39.6% (39.9% last year and 43% in 2013) use government resources, while 53.5% (46.2% in 2014 and 37.5% in 2013) use commercial vendors. Finally, using HR consultants to develop policies trails the group at 25% (26.3% last year and 24.4% in 2013).
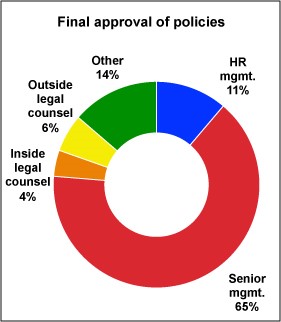
Senior management has final approval of policies for 65.1% (63.7% in 2014). Legal counsel has final approval for 10% (11.4% in 2014) of survey participants that answered the question, and HR management has approval for 11.2% (11.8% in 2014).
Policy Implementation
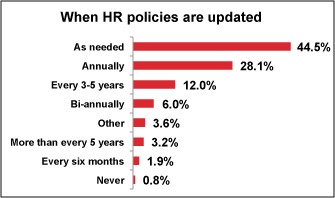
When asked how often policies are updated, 44.5% of survey respondents indicate they update policies as needed and 28.1% state they update policies annually. Though a mere 6% update their policies bi-annually, a hefty 12% update them on a 3-5 year schedule and a less cautious 3.2% update theirs even less frequently (more than 5 years between policy reviews).
Though some policies are specific to employees based on their FLSA classification (exempt/nonexempt) for 44.1%, all policies apply to all employees for 48.5% (47.8% last year and 61.9% in 2013). Breaking this down even further, some policies are specific to either office or production employees for 18.8% (same as 2014) and policies are specific to department, location, or worksite for 27.3% (27.1% in 2014).
These images side by side please, with space in between! Email marketing – please delete this text (thanks!)
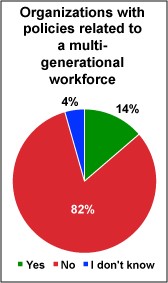

Policies that are directly related to workers categorized as “millennials” are in place for 8%, and 13.7% have modified or added policies directly related to a multigenerational workforce. Surprisingly, 90.6% have no policy covering use of wearable technology such as smart glasses or wearable camera/video devices. Though 6.3% have a policy regarding all camera/video devices, only 1.1% address wearable video devices and only 1.2% have a policy that addresses wearable cameras. Smart glasses are addressed in policies for 1.5% of participants, and smart watches are specified in policies for .8%. More generic BYOD (Bring Your Own Device) policies, in place for 41%, include:
- Cell phones, 76.4%
- Tablets, 42.8%
- Laptops, 41.6%
- Flash memory drives (thumb drives), 30.2%
- Personal music devices, 23.6%
- Digital cameras or movie recorders, 21.2%
- Other (please specify), 18.0%
- Book readers, 11.9%
Non-compete or nonsolicitation agreements are implemented for 49.9%, and are a requirement for all positions for 43.6%. They are a requirement for sales positions at 27.9% of participants’ companies, and for professional positions at 20.9%. Not surprisingly, they are also required for management positions at 22% and for executive level positions at 33.4%. The time restriction for these policies varies from less than 6 months (6.78%) to more than a year (32.5%), with the most common restriction period being up to 1 year (52%).
Want to ensure your strategic planning is up to snuff? Join us Wednesday, September 30, 2015, for a new interactive webinar, Strategic Planning for HR: A Blueprint for Creating Aligned and Adaptable Plans. Earn 1.5 hours in HRCI Recertification Credit and 1.5 hours in SHRM Professional Development Credit. Register Now
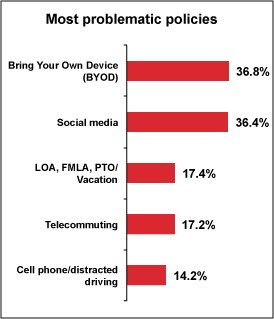
The five HR policies most identified as potentially problematic in the coming year include BYOD for 36.8%, social media for 36.4%, employee leave for 17.4%, telecommuting for 17.2%, and cell phone/distracted driving for 14.2%. The five HR policies least identified as problems in the making include military/reserve for 1.6%, bulletin boards for 1.7%, at-will employment for 2.9%, Equal Employment Opportunity Commission (EEOC) for 3.4%, and travel for 4.1%.
Identified as potentially problematic for 8.2%, background check policies are in place for 81.3% of survey participants, though applicable only to final candidates for 67.1%. Positions for which background checks are required include:
- Public safety positions, 23.3%
- Medical positions, 24.3%
- Facility maintenance/cleaning positions, 34.8%
- Security personnel, 37.6%
- Positions that involve working with children, 38.1%
- Positions that interact with customers/clients in their homes, 39.4%
- Information technology positions, 49.4%
- Positions that require operating vehicles, 52.9%
- Positions that involve handling money, 54.0%
- Management positions, 62.1%
- Positions that involve managing finances, 69.3%
Credit checks, however, are a requirement for positions that involve managing finances (77.5%), positions that involve handling money (46.1%), information technology positions (18.3%), and management positions (31.9%).
Background checks are conducted by outside vendors for 74.7% and by HR staff for 24.7%, while HR checks only work references for 21.7%. Of those companies utilizing outside vendors, only 14.1% have concerns about their adherence to the Fair Credit Reporting Act (FCRA).
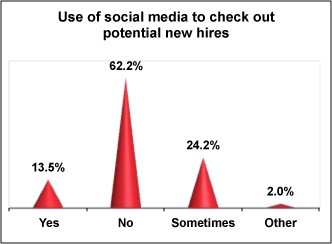
Social media is used to check out potential new hires by 13.5% and is sometimes used by 24.2%. While department management takes on this task for 16.2%, it is primarily an HR staff function for 37.6% and the responsibility of HR management for 51.5%. LinkedIn is the social media site most used (74.8%) followed closely by Facebook (71.7%), with Google a distant third (43.2%). Concerns about using social media for background checks include finding information such as age, marital status, health issues, etc. (66.5%), not being sure the person found is the correct person (57.6%), and knowing whether a troublesome item was posted by the applicant or a network contact (51.3%).

Tomorrow, more results from the 2015 Policy Practices Survey, plus an introduction to an interactive webinar, Strategic Planning for HR: A Blueprint for Creating Aligned and Adaptable Plans.
